Hi, my app keeps crashing either at first load or while waiting for an answer from a fetch call. Of course in the dev environment I cannot catch the problem, it happens in the staging environment where I started to scale the usage a bit to test exactly these kind of problems.
I also noticed at times when the Jira instance seems very busy, the crash happens more often, so I suspect some problem around the async operations where maybe I forgot to wait long enough for the answer or simply timeouts are triggered and they are not correctly treated in the code.
I am interested to hear suggestions about how to hunt down these problems, debug strategies, tips and tricks to solve the app stability at high loads. Thanks.
2 Likes
Hey @RichardVencu,
Would you mind sharing the exact error message(s) you are seeing? This will help us provide some more guidance 

I am using these:
import ForgeUI, {
  Button,
  render,
  Fragment,
  IssuePanel,
  IssuePanelAction,
  useAction,
  useState,
  useProductContext,
  Select,
  Option,
  TextField,
  TextArea,
  Form,
  DatePicker,
  Text,
  StatusLozenge,
  Toggle
} from '@forge/ui';
import worklogOperations from './worklogOperations';
import wlData from './worklogData';
import { properties } from '@forge/api';
import {
  getCurrentDateTime,
  validate,
} from './utils';
The error appears either at first load/first rendering or when the UI wants to render again (like when the error messages should be printed below the form)
But it is intermittent, usually a refresh will allow it to work normally.
I populated a lot of checkpoints and ran forge logs -e staging with results such as below. It is spooky because all crashes are not in the same point (I feel some logs lines were sent before the crash but never arrived in the log).
Towards the end of the log section, the app ran almost to the end, and it crashed at rendering time. The same error message always. Almost never happens in development and it has instances of successful complete runs in staging env which rules out bad scopes.
C:\Users\user\worklogapp>forge logs -e staging
INFO    2020-12-17T21:22:19.563Z 123d9e97-9f90-4038-9f2e-04093abe380b API call to JIRA WL response status: Created
INFO    2020-12-17T21:26:08.938Z c85d610d-4b01-4afe-9767-555799181b5d API call to JIRA WL response status: Created
INFO    2020-12-17T21:26:08.949Z c85d610d-4b01-4afe-9767-555799181b5d crash check -1
INFO    2020-12-17T21:26:17.240Z c85d610d-4b01-4afe-9767-555799181b5d API call to TOOLS response status: Created
INFO    2020-12-17T21:35:23.657Z a864751b-4246-47eb-aaa0-25352f0033e0 API call to JIRA WL response status: Created
INFO    2020-12-17T21:35:23.673Z a864751b-4246-47eb-aaa0-25352f0033e0 crash check -1
INFO    2020-12-17T21:37:28.129Z 6d5df2bd-c6c4-4e20-9d42-99062bbf32ad API call to JIRA WL response status: Created
INFO    2020-12-17T21:37:28.134Z 6d5df2bd-c6c4-4e20-9d42-99062bbf32ad crash check -1
INFO    2020-12-17T21:37:36.484Z 6d5df2bd-c6c4-4e20-9d42-99062bbf32ad API call to TOOLS response status: Created
INFO    2020-12-17T21:45:26.867Z 14e75cf9-468b-457d-ab52-9801a3ae0529 API call to JIRA WL response status: Created
INFO    2020-12-17T21:45:26.867Z 14e75cf9-468b-457d-ab52-9801a3ae0529 crash check -1
INFO    2020-12-17T21:45:35.372Z 14e75cf9-468b-457d-ab52-9801a3ae0529 API call to TOOLS response status: Created
INFO    2020-12-17T21:52:30.783Z d3729a26-6ae8-4048-bc20-44733197b0ff API call to JIRA WL response status: Created
INFO    2020-12-17T21:52:30.793Z d3729a26-6ae8-4048-bc20-44733197b0ff crash check -1
INFO    2020-12-17T21:52:39.258Z d3729a26-6ae8-4048-bc20-44733197b0ff API call to TOOLS response status: Created
INFO    2020-12-17T21:52:39.293Z d3729a26-6ae8-4048-bc20-44733197b0ff Crashpoint1
INFO    2020-12-17T21:54:33.144Z 7c5e3800-66b1-4b4b-8b6a-79e9ca6d3795 API call to JIRA WL response status: Created
INFO    2020-12-17T21:54:33.145Z 7c5e3800-66b1-4b4b-8b6a-79e9ca6d3795 crash check -1
INFO    2020-12-17T21:54:41.614Z 7c5e3800-66b1-4b4b-8b6a-79e9ca6d3795 API call to TOOLS response status: Created
INFO    2020-12-17T21:54:41.662Z 7c5e3800-66b1-4b4b-8b6a-79e9ca6d3795 Crashpoint1
INFO    2020-12-17T21:54:41.663Z 7c5e3800-66b1-4b4b-8b6a-79e9ca6d3795 {"timeSpentSeconds":612,"comment":{ "version": 1, "type": "doc", "content": [{ "type": "paragraph", "content": [{ "type": "text", "text": "ALERTA: ati pontat pe un cod nealocat. Codurile alocate dumneavoastra sunt I-9022-P30, I-9022-P32, I-9022-P33, I-9022-P34, TEST. Contactati managerul dvs pentru detalii. Pontajul a fost salvat fara modificari." }] }] }}
INFO    2020-12-17T22:01:58.609Z 3b6d1ef7-de1a-40fb-9f18-5a1821a1bf9a API call to JIRA WL response status: Created
INFO    2020-12-17T22:01:58.609Z 3b6d1ef7-de1a-40fb-9f18-5a1821a1bf9a crash check -1
INFO    2020-12-17T22:02:06.770Z 3b6d1ef7-de1a-40fb-9f18-5a1821a1bf9a API call to TOOLS response status: Created
INFO    2020-12-17T22:02:06.770Z 3b6d1ef7-de1a-40fb-9f18-5a1821a1bf9a Crashpoint1
INFO    2020-12-17T22:02:06.788Z 3b6d1ef7-de1a-40fb-9f18-5a1821a1bf9a /rest/api/3/issue/ABAP-47/worklog/15545
INFO    2020-12-17T22:02:06.788Z 3b6d1ef7-de1a-40fb-9f18-5a1821a1bf9a {"timeSpentSeconds":612,"comment":{ "version": 1, "type": "doc", "content": [{ "type": "paragraph", "content": [{ "type": "text", "text": "ALERTA: ati pontat pe un cod nealocat. Codurile alocate dumneavoastra sunt I-9022-P30, I-9022-P32, I-9022-P33, I-9022-P34, TEST. Contactati managerul dvs pentru detalii. Pontajul a fost salvat fara modificari." }] }] }}
INFO    2020-12-17T22:02:07.358Z 3b6d1ef7-de1a-40fb-9f18-5a1821a1bf9a Crashpoint2
INFO    2020-12-17T22:02:07.358Z 3b6d1ef7-de1a-40fb-9f18-5a1821a1bf9a API call to EDIT response status: OK
INFO    2020-12-17T22:02:07.358Z 3b6d1ef7-de1a-40fb-9f18-5a1821a1bf9a crash check 0
INFO    2020-12-17T22:02:07.358Z 3b6d1ef7-de1a-40fb-9f18-5a1821a1bf9a crash check 1
INFO    2020-12-17T22:02:07.358Z 3b6d1ef7-de1a-40fb-9f18-5a1821a1bf9a crash check 2
INFO    2020-12-17T22:02:07.358Z 3b6d1ef7-de1a-40fb-9f18-5a1821a1bf9a crash check 3

Apparently yes. I have a number of API calls, mostly to Jira Cloud API and once to my external app. I stopped waiting for last ones (like updating final information in Jira issues) and suddenly it became hard to crash the app.
I take a look at my external WS performance as well to make sure I get a good execution margin timewise…
Will this 10 seconds limit be raised in the future? Most of the time Jira API is slow and this is really limiting…
Code optimization: I had a lot of useProductContext() calls in various places, now I reduced to a single call where I set all constants I need from the context. I see an apparent gain of about 4 seconds over this one.
2 Likes
Just want to point out: really appreciate you sharing your debugging process with us here.
4 Likes
The logs are the right thing to watch because the timestamps can show exactly how long various parts of code execution takes.
I was able to reduce the external fetch API call from 7 seconds down to 2 seconds. As a backend, I am using a slow PHP app that is transactional in nature, so no help from caching, and I had to introduce async processing using ideas from this project: deliciousbrains/wp-background-processing: WordPress background processing class (github.com)
Then inside the async execution, I made API calls back to Jira instance to send execution results. Perhaps these calls can also be made to the very forge app and display some results in the panel.
3 Likes
One more question, maybe I am doing something wrong. Here is a couple of invocations where I logged two checkpoints, first immediately at beginning of App definition and second just before rendering.
First invocation shows me switching the panels. It is clean and as expected.
But second represents a complete page reload, and I see about 24 starts before the first render. Can someone explain this so I can optimize the code?
invocation: ed17ed7462cee999 index.run
INFO    14:03:09.965  ed17ed7462cee999  start session
INFO    14:03:09.967  ed17ed7462cee999  before rendering
INFO    14:03:09.968  ed17ed7462cee999  start session
INFO    14:03:09.969  ed17ed7462cee999  start session
INFO    14:03:09.969  ed17ed7462cee999  before rendering

invocation: 4bd16c48a479c41a index.run
INFO    14:03:38.219  4bd16c48a479c41a  start session
INFO    14:03:38.412  4bd16c48a479c41a  start session
INFO    14:03:38.413  4bd16c48a479c41a  start session
INFO    14:03:38.662  4bd16c48a479c41a  start session
INFO    14:03:38.662  4bd16c48a479c41a  start session
INFO    14:03:38.662  4bd16c48a479c41a  start session
INFO    14:03:38.662  4bd16c48a479c41a  start session
INFO    14:03:38.662  4bd16c48a479c41a  start session
INFO    14:03:38.899  4bd16c48a479c41a  start session
INFO    14:03:39.186  4bd16c48a479c41a  start session
INFO    14:03:39.417  4bd16c48a479c41a  start session
INFO    14:03:39.633  4bd16c48a479c41a  start session
INFO    14:03:39.834  4bd16c48a479c41a  start session
INFO    14:03:40.187  4bd16c48a479c41a  start session
INFO    14:03:40.428  4bd16c48a479c41a  start session
INFO    14:03:40.691  4bd16c48a479c41a  start session
INFO    14:03:40.891  4bd16c48a479c41a  start session
INFO    14:03:41.192  4bd16c48a479c41a  start session
INFO    14:03:41.192  4bd16c48a479c41a  start session
INFO    14:03:41.193  4bd16c48a479c41a  start session
INFO    14:03:41.451  4bd16c48a479c41a  start session
INFO    14:03:41.727  4bd16c48a479c41a  start session
INFO    14:03:42.200  4bd16c48a479c41a  start session
INFO    14:03:42.200  4bd16c48a479c41a  start session
INFO    14:03:42.200  4bd16c48a479c41a  before rendering
Thanks @RichardVencu for sharing your debugging process here. The timeout would have been my guess, so I’m glad you found it
In terms of the last message, it’s a little hard to tell without seeing your code. Is it possible that you have some kind of loop happening that triggers the “start session” log line?
I don’t seem to have access to view it 
Until easier access, here is some observation I made. I put the start session log like this
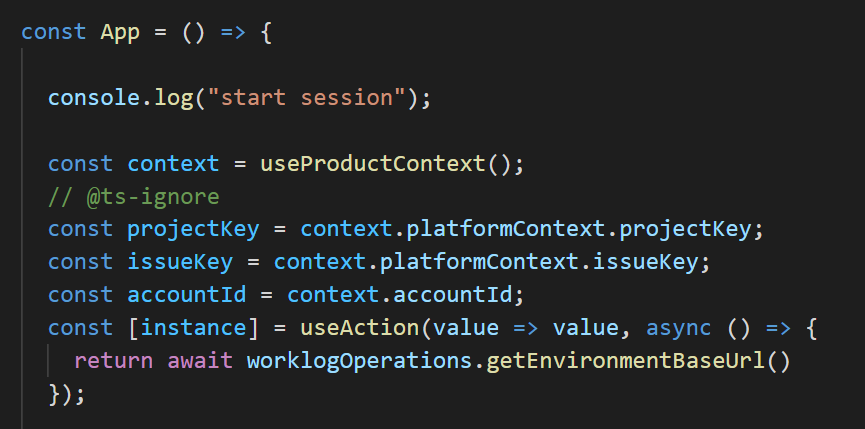
Then I noticed, everytime I use useState or useAction below, the app restarts the code execution from the first line… The count matches. I even experimented commenting some lines, and the count decreased accordingly with the number of reduced usage of these hooks.
Now, it appears I should store and retrieve things in the Jira project properties as a single value (perhaps an object) instead 9 values and have a single useAction for all. But I am interested in some explanation, since I am not very familiar with react I suppose I do not grasp the correct usage of these elements.
Hi,
I ran into exactly the same issue today. I have a forge app providing a modal dialog on the issue action module. I already thought about the timeout thing because it is depending on the amount of data that is loaded if the app crashes or not. When the app crashes I see a call in the browsers dev console which is stopping after 10s. I also tried to log “start session” in my code. I can confirm that the app code seems to be running for each hook I have in the code.
At first I had 18 start session logs. Then I removed one useState hook and I had 17.
Is there any way to avoid that? Might the timeout value be increased in the future? Or has anyone an idea how to improve the code to avoid the crashing?
Currently it seems impossible to me to run my app on a busier instance as it would run into the timeout every time.