Hello,
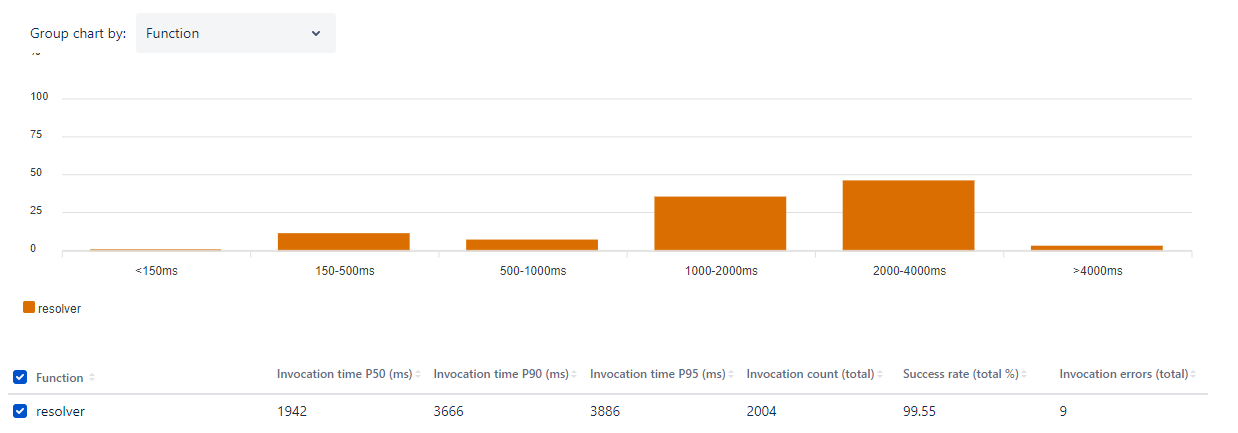
I’m loving the new Invocation Time chart in the developer console, but when I try to group the data by function, it’s always just showing ‘resolver’.
My resolver file (index.js) has 15 different resolver definitions, so I would expect those to be the function names, but that doesn’t appear to be the case.
Here’s a brief snippet of my index.js:
resolver.define('getUsers', async () => await getUsers());
resolver.define('getProjects', async () => await getProjects());
resolver.define('getGroups', async () => await getGroups());
Yet when I look a the chart, I don’t see any of these resolver functions – it’s just rolling them all up into ‘resolver’.
What am I missing?
2 Likes
Hi @BenPierce
Thanks for your question. I have reached out to our team to ask about this. Will update you asap. Thanks.
It seems that you have defined only resolver as a function in your manifest and that’s you are seeing only that in the chart. To be able to see all the functions in the chart, you will have to put in the manifest in a different way like:
modules:
  function:
    - key: getUsers
      handler: index.getUsers
    - key: getProjects
      handler: index.getProjects
    - key: getGroups
      handler: index.getGroups
Then you should be able to see each of them in the chart. Hope this helps.
2 Likes
Hi,
This should work, but I don’t think this is intuitive. For this reason, Atlassian’s own sample apps that use Custom UI, has the same problem, atlassian / todo-app-custom-ui / src / index.js — Bitbucket
This sample app will also display a single invocation time metric for “resolver”, but actually it contains different methods for “create”, “update”, “delete-all”, “get-all”. We have the sample problem too in our own code.
1 Like
Thanks Anmol, looks like a reasonable refactor, given that I don’t have too many resolver functions – appreciate the response!
Yeah, it would be nice if Atlassian could parse these out automatically, given the fact that we’re already defining our functions with names, but c’est la vie!