Hi all,
If you submit an app to participate in the Cloud Fortified App program, we’ll start collecting reliability metrics for that app. We’ll then grant you access to the Fortified statuspage so that you can track those metrics for your app. Once you have access, you’ll see something like this (with metrics for your apps):
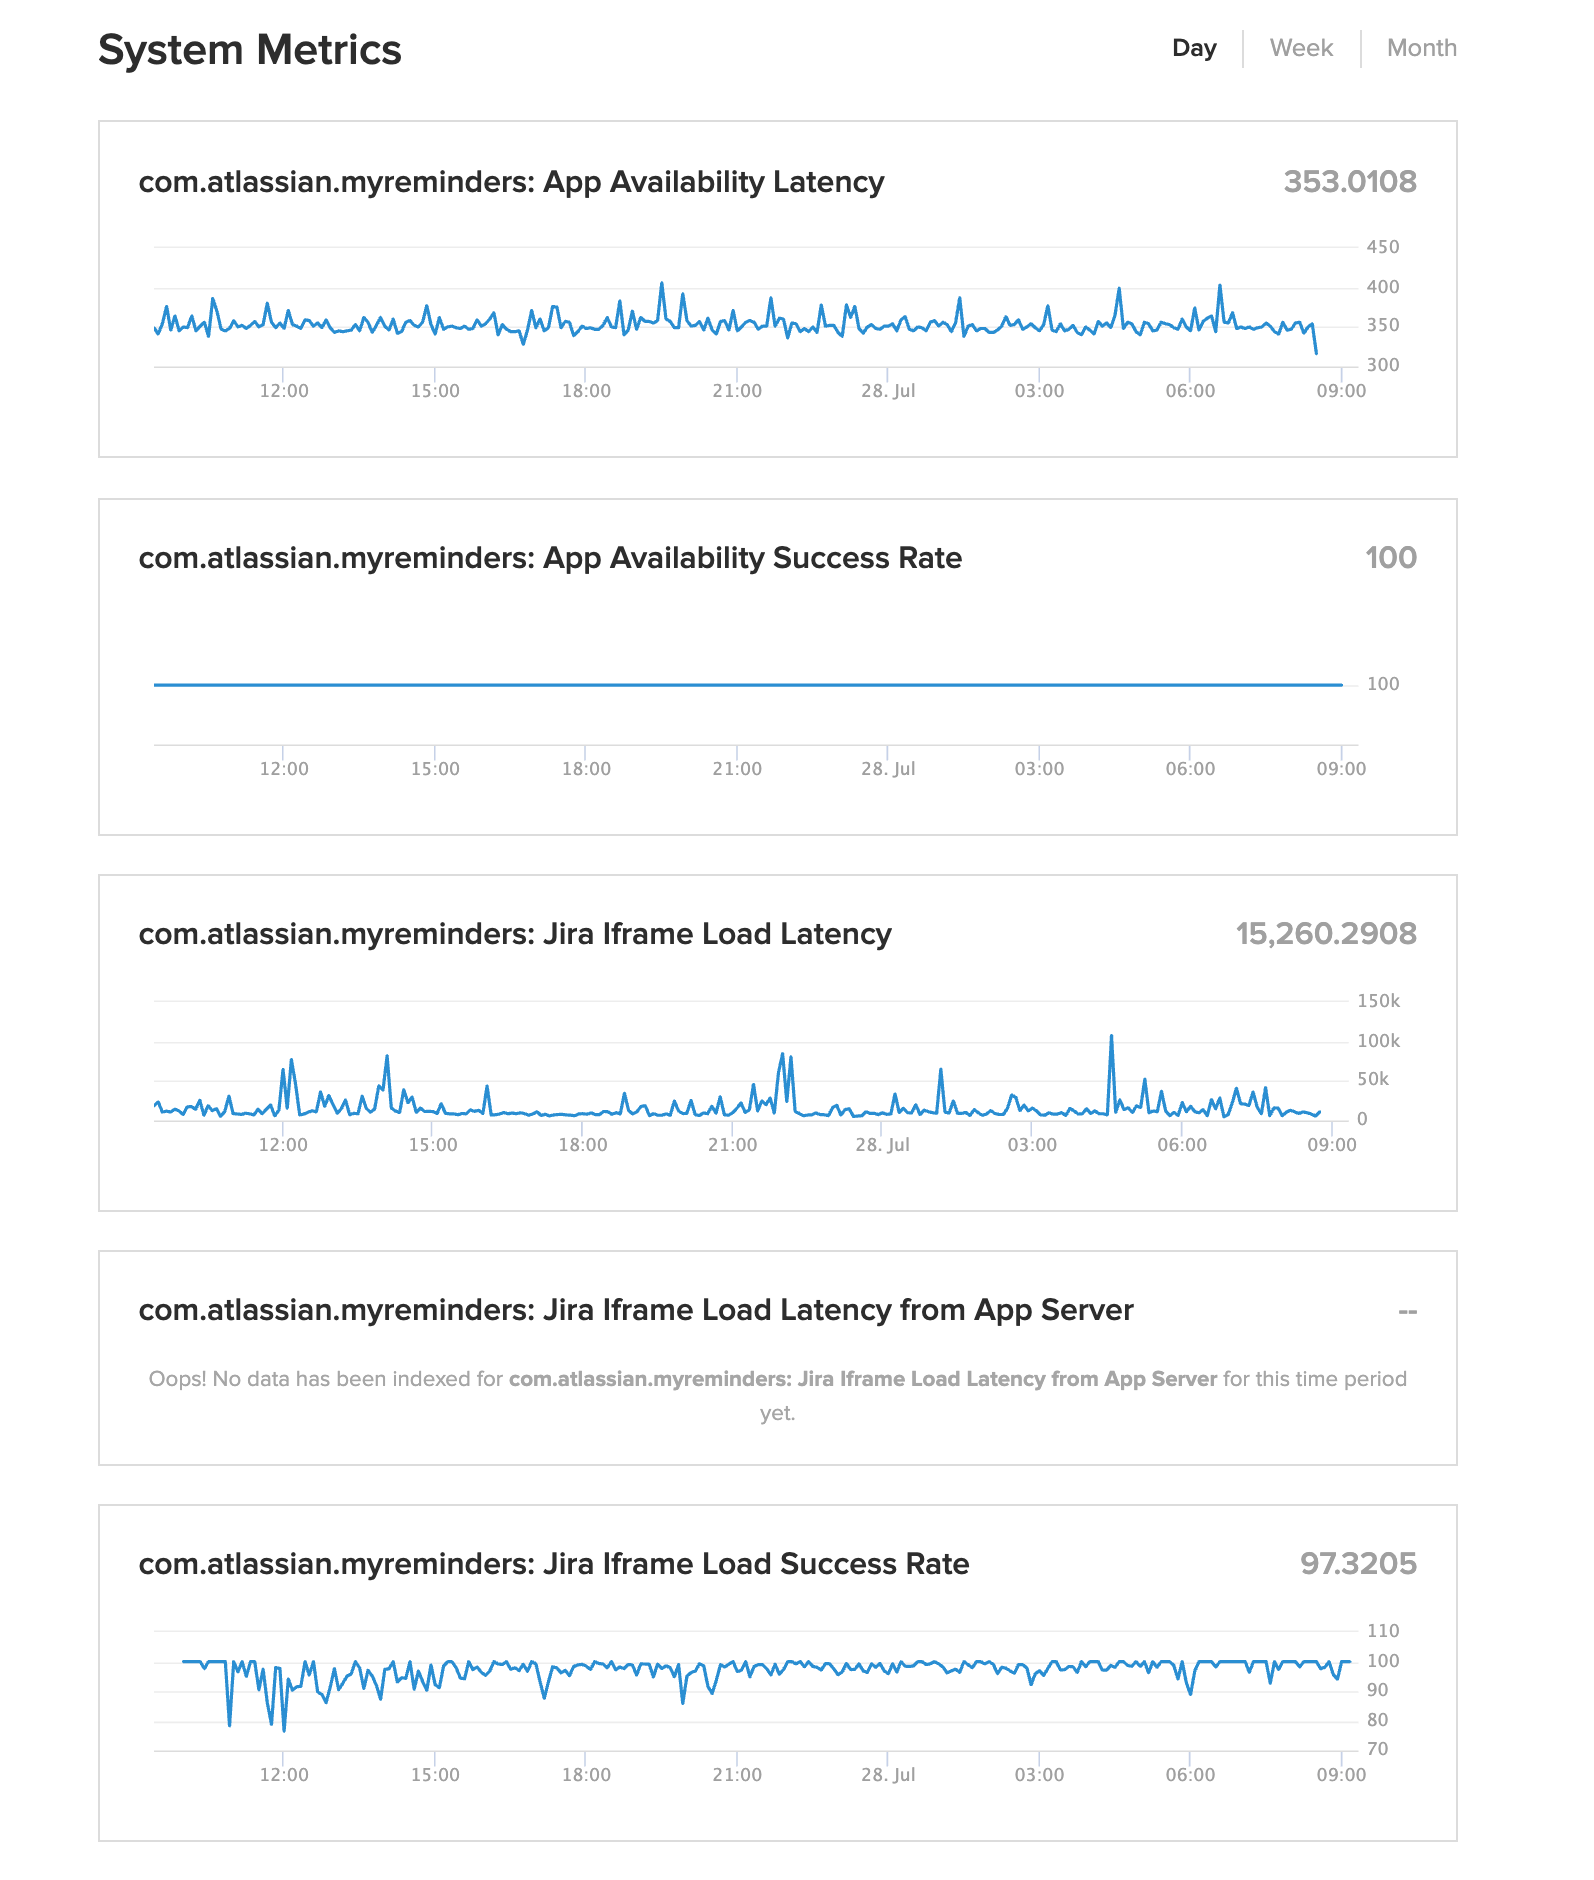
A few of you had questions about these metrics, so here are some extra notes on what they mean for your info:
- App Availability Success Rate (%): This is what we measure as the App Availability SLI as per the docs. It is the ratio of successful over total requests that we make to the healthcheck URL that you supplied.
- App Availability Latency (ms): this is the response time we’re measuring when requesting your healthcheck URL. This is mostly informational but it can be useful to know if it’s creeping up because responses over 3s will be treated as failures.
- Iframe Load Success Rate (%): This is what we measure as the Iframe load success rate SLI as per the docs. It is ratio of “successful” iframe requests over the total iframe requests made to your app. In this metric, a “success” event represents the app’s iframe connecting back to the host frame over the postMessage API that Atlassian Connect uses to communicate between the product window and the app iframe in the browser within 12s. For most apps the connection is established over that bridge when all.js is loaded. A failure is counted if the host does not get that connection over the bridge within those 12s (we track this as a failure/timeout event for this metric even if the iframe load does eventually complete after 12s). This is our best effort at a generic success/failure metric without any bespoke logic in the app, because from the parent frame we cannot see anything about the response of the iframe request, not even the response code. This metric is far from perfect: we know that there are client-side reasons outside of your control as to why a given user might see delays between the iframe load initiating and the child frame connecting back over the bridge (slow connections, browser throttling requests etc…). We are currently working on improving this metric to make it more consistently actionable. Meanwhile, if you see dips here that don’t correspond to issues in your app, we can work with you to understand them.
- Iframe Load Latency (ms, P90): Same as above but looking at the timing rather than a binary success/failure metric.
- Iframe Load Success Rate from App Server (%): If the “built-in” iframe success rate metric described above is not representative of your app’s reliability, you have the option of implementing logic to send us your view of success or failure events for each iframe load using the Metric Publish API. If you send us this data, we will examine this in precedence over the built-in metric.
- Iframe Load Latency from App Server (ms, P90): Same as previous – you can include a latency figure in this custom metric too.
- Lifecycle Success Rate (%): This is what we measure as the Lifecycle event success rate SLI as per the docs. Lifecycle events are installs, updates & uninstalls. This metric is the ratio of successful events over total events.
- Lifecycle Failure Count (event count): Because lifecycle failures can be quite rare, to make failures more visible we also include a graph showing raw counts of failed events. This is informational.
- Lifecycle Latency (ms, P90): This is the time we measure from initiating the lifecycle event to receiving a response from the app.
- Webhook Delivery Success Rate (%): This is what we measure as the Webhook delivery success rate SLI as per the docs. It is the ratio of “successful” webhook deliveries to the app, over the total attempts. One complexity to keep in mind here: this metric is currently measured differently in Jira and Confluence. In Jira a failure means we have been unable to reach the app; any response from the app, regardless of response code, is treated as a success. In Confluence on the other hand, a failure is counted if we cannot reach the app OR if the app responds with any non-2xx response code. We’ll soon normalise this.
- Webhook Latency (ms, P90): as above but looking at the timing of the overall webhook delivery. Currently, this timing can sometimes include queuing overhead on the Atlassian side, which means you may occasionally see spikes that are not related to issues in your app and that you cannot action. We’re working to improve this metric to make it more consistently actionable.
- Synthetic Check Success Rate from App Server (%): we expect CFA apps to run, or to be working towards running, synthetic checks that exercise their apps’ key experiences against a Developer-First rollout instance of Jira or Confluence. Once you have these tests set up, we ask that you send us the results using the Metric Publish API. This will allow us to get a predictable understanding of the robustness of your app’s key functionality, regardless of traffic load, as well as allow us to correlate any dips with changes on the Atlassian side.
- Synthetic Check Latency from App Server (ms, P90): a timing field you can supply along with synthetic test success/failure results. Informational only, we don’t currently use this.
Hope this is useful. If you have any further questions on these metrics or on CFA in general, don’t hesitate to ask! ![]()