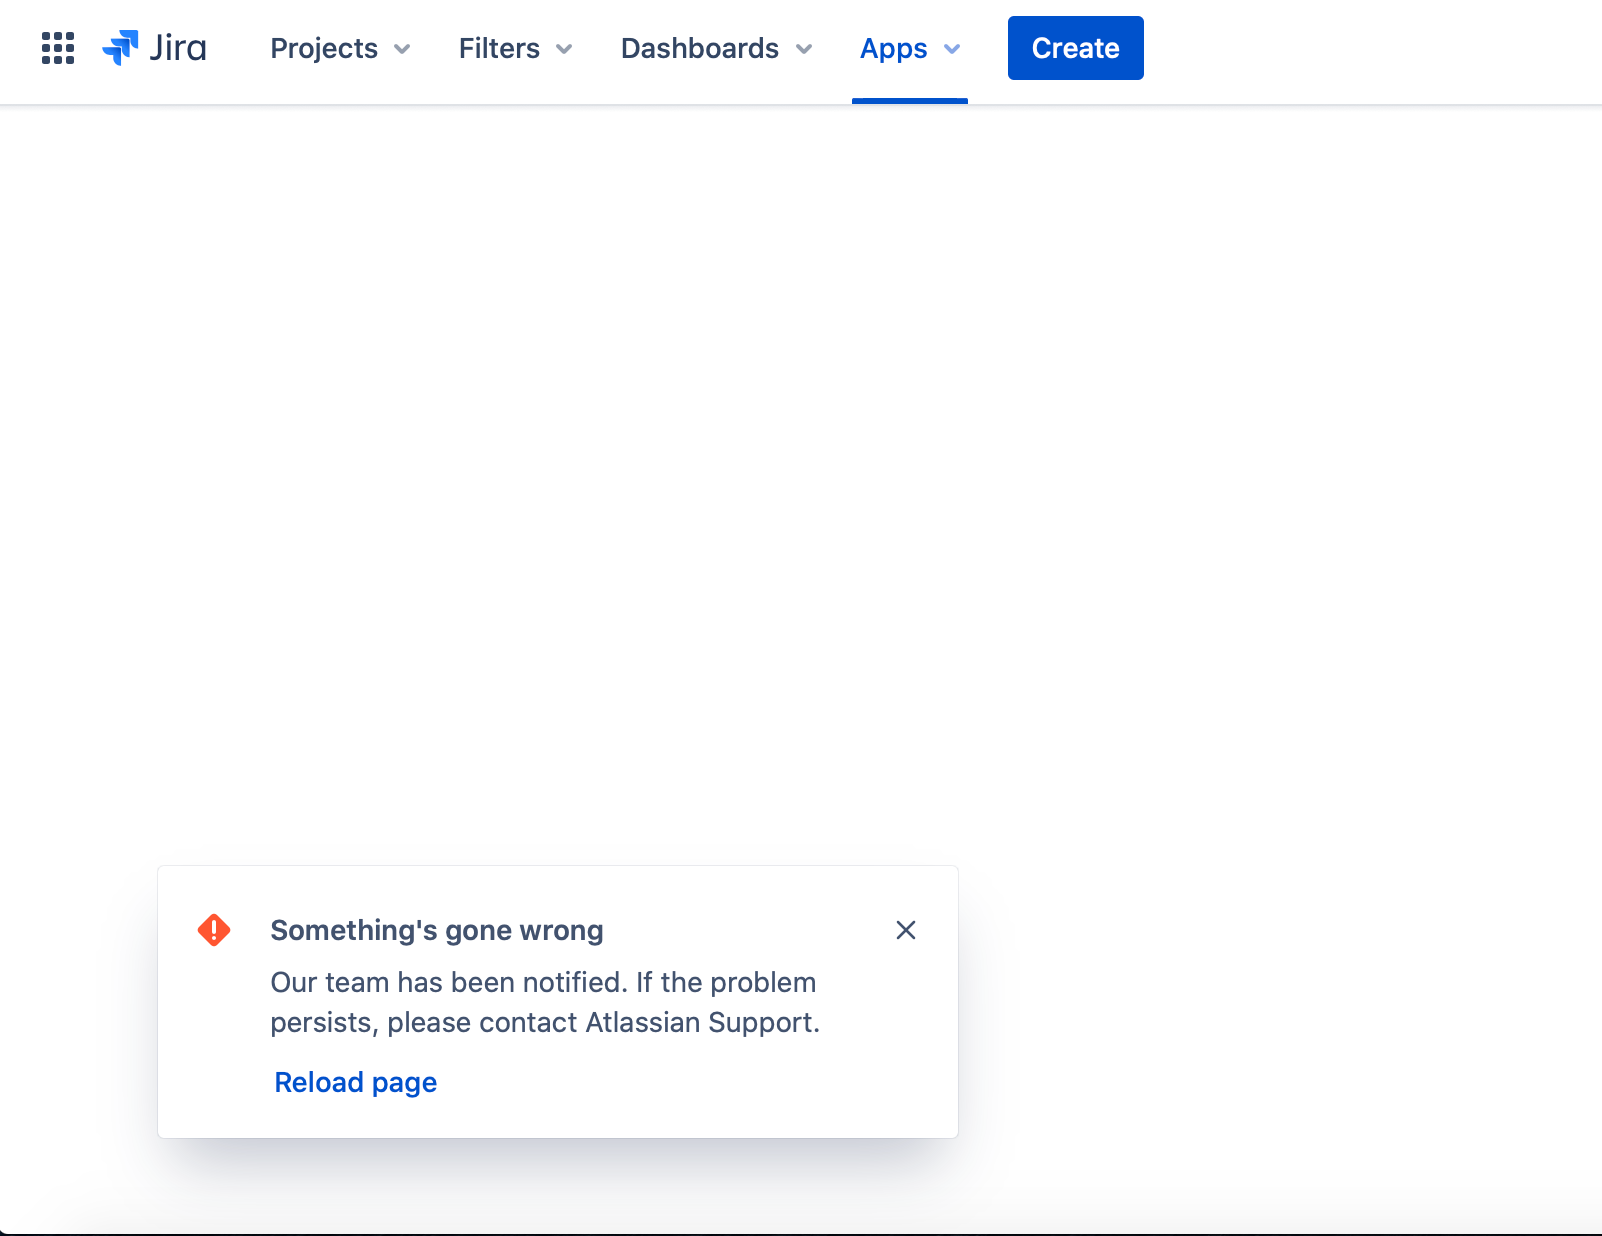
for about week or two we’ve been getting reports from our customers that occasionally our apps fail to load and the standard message is shown instead (the one with large yellow triangle, that advice to contact app’s developers). We think that this is a problem that may be affecting other vendors as well (please see the screenshot). The requests for iframes’ content are successful but nonetheless Jira says that it couldn’t load the add-ons. We are not sure if this happens on pages other than issue view.
The timeout error is displayed if the host product (Jira in this case), fails to set up the JavaScript API with the app. This often happens when all.js is not loaded by the app into its iframe. If this is occurring intermittently for a number of different apps and users, then there might be a reliability issue we need to investigate.
I’ll draw the engineering team’s attention to this.
So maybe it’s a problem with availability of all.js? What worries us is that all add-ons time out and there is not a single day without a new report from our customers. We even got a story that an employee was severely reprimanded by their boss due to not completing checklist items. It’s crucial for us and other vendors that the apps can be reliably accessed.
Can you give an indication of how reproducible the timeouts are that you’re reporting. The issue being investigated under ACJS-1134 is extremely rare so I want to be clear we are talking about the same problem.
They are very rare. I experienced the problem myself today and it was happening for all the page loads during a few minutes period. After that, the problem disappeared.
However, with over 10k customers, we get a few support request a day with the report suggesting this exact problem.
It started happening around 2-3 weeks ago. Before that, we were getting around 1-2 reports per fortnight and they were related to firewall/proxy blocking requests to our servers.
So, from our perspective the problem is very visible and troublesome.
Do you have any metrics indicating how often this occurs? Our indication is that this is extremely rare, but if believe otherwise then please let us know.
Only one such report so far, but what’s interesting is that Atlassian support couldn’t reproduce when connecting you the same platform. Looks like the error “sticks” to the browser even after a refresh. But investigation is still underway.
In our case three report from customer… once this issue start it will continue till 30-45 min. after that its start working… Some time our internal development team also face the same issue with same duration.
@dmorrow we had 3 cases reported by different customers for different Apps, reported on the dates:
28.07.2020
31.07.2020
06.08.2020
I would like to note that “extremely rare” is a subjective definition
Unfortunately, we are only aware of the cases that are reported by the customers (which could be just a vocal minority). The problem is that this error doesn’t seem to be logged anywhere (and technically, if our Apps don’t receive a request which seems to be the case — we can’t log it, so there is no way to tell the frequency of the error occurrence).
I don’t mind the fact that there may be issues, but I find it very frustrating that customers are being told to contact the developer for support.
I’ve been seeing this issue too in the last couple of weeks with our app ScriptRunner for Jira Cloud. It consistently appears around the start of day when my browser re-opens with yesterday’s tabs but it also re-appears after a few hours of use. Clearing my cache and closing the browser fixes it but this issue always comes back. I suspected it might be related to caching, seeing others with the same issue is somewhat comforting as hopefully Atlassian will look into a solution as this is indeed very frustrating.
Atlassian staff, I know the root cause might not be easy to find, but please fix it - we are already getting negative reviews for what customers think is our failure and I’m sure other vendors are also getting such reviews.
Last customer reporting this was today August 19 2020 at 10:40 BST. And the customer came back 10 minutes later saying that after clearing cache the app started working again. This is not OK tbh, customers having to clear caches to make apps work, most will just drop the tool thinking is broken given that native pages work. And they’ll wind up giving bad reviews like @maciek pointed out.
As mentioned in the thread I linked to, we had one of our devices experience this and it wasn’t only our apps but any apps on that device failed to load, including Automation for Jira, whilst native pages worked fine. So might be related to connect service…
I also raised a ecosystem ticket on 20th July about this which was just answered today: Jira Service Management